 LiU Homepage
TSEK06 - VLSI konstruktion
General Tips and Recommendations for Reports
Plotting
Export schematics
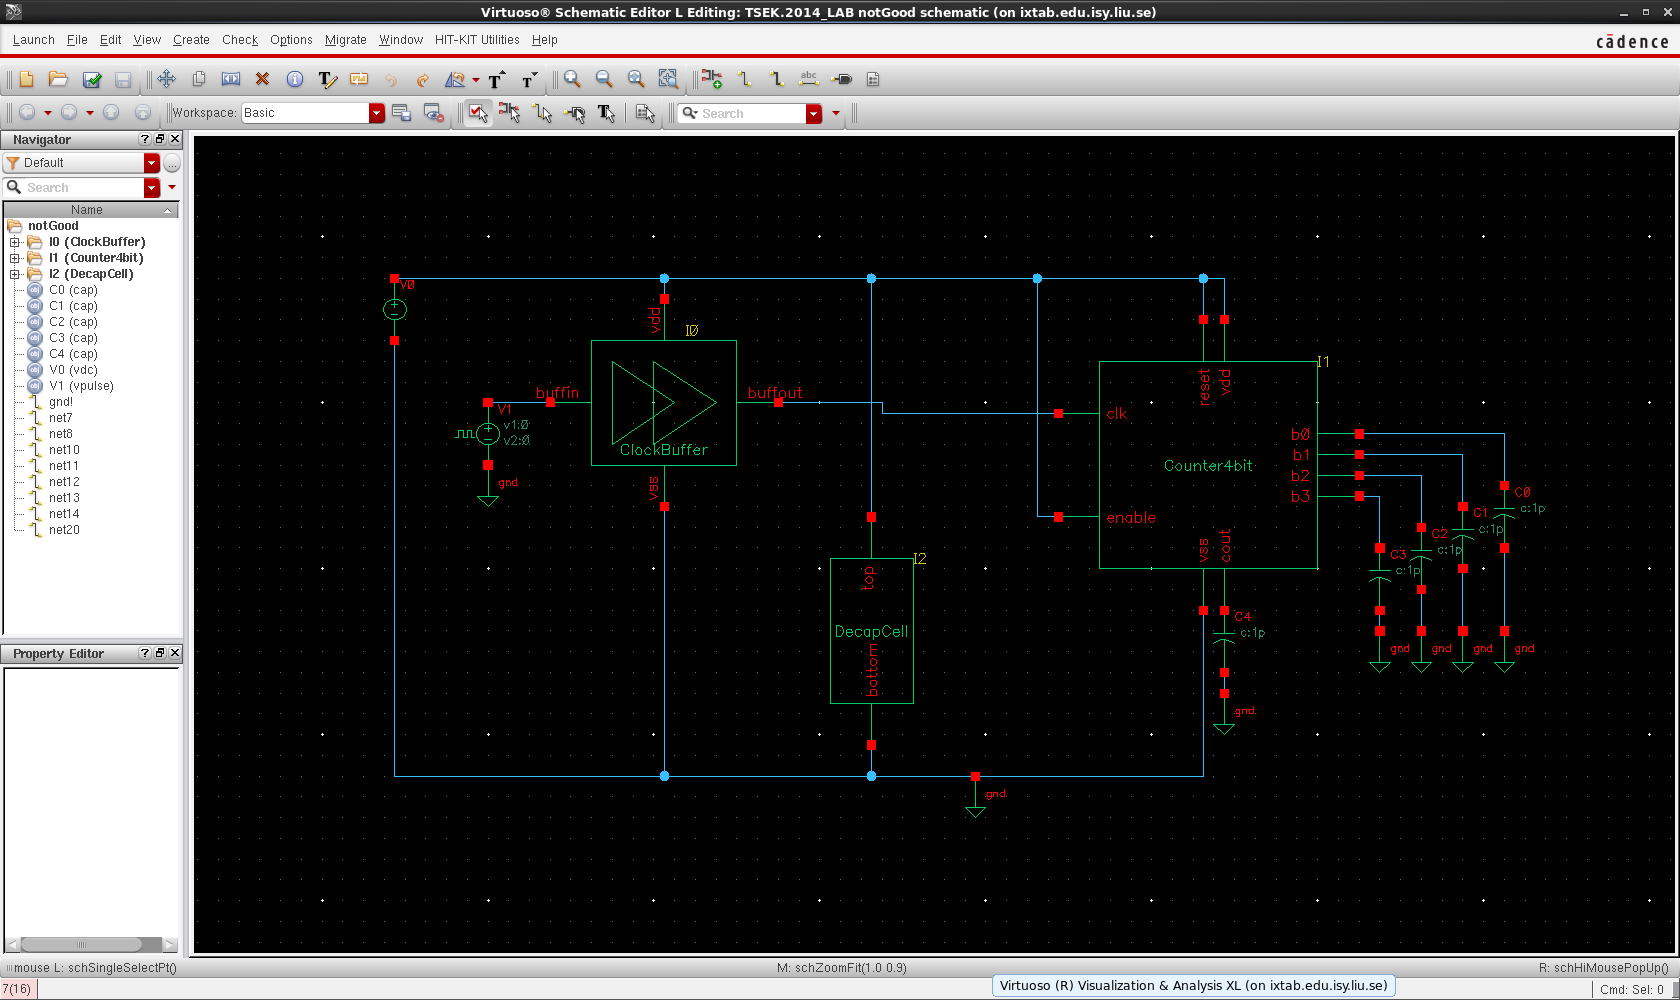
Just making a screenshot from Cadence of the transistor-schematic or block-schematic is usually not a good way to create nice pictures or figures. An example can be viewed in figure 1.
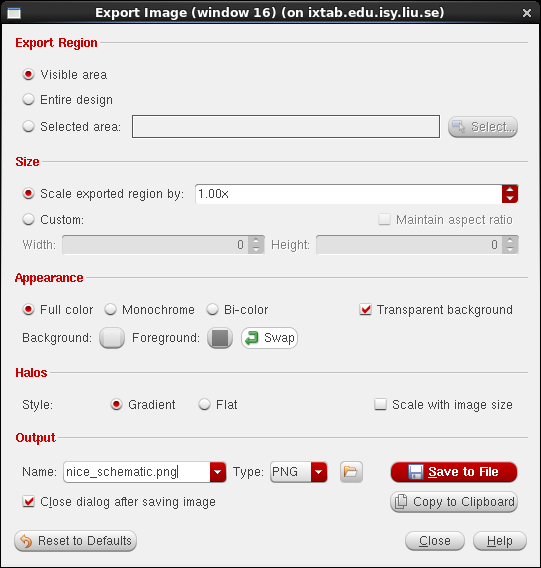
But, if your schematics are clear you can use them in your report. Especially smaller schematics are suitable to export to the word processor directly from Cadence. This is done by clicking File -> Export Image... in the schematic editor. Be sure to select Transparent background and press Swap if needed to get a dark schematic on a bright background, see figure 2. Then just include it in Word or use \includegraphics{...} in Latex to add it to your report.
For larger circuits it might be better to draw a completely new and simpler schematic in a different software, for example; Microsoft Word, XCircuit, Inkscape, Visio etc. They all have their strength and weaknesses but can all be used to create elegant schematics.
Export Simulation Graphs
Simulation results are a very important part of the status and project reports. It is imperative that the results are presented in a clear and precise way. The tool used for simulations in this project course is Spectre, included in Cadence. Cadence has a graphical user interface that presents the simulation results on the screen. There are a number of ways to include these graphs in your document. The first way is to click File -> Save Image... in the Visualization & Analysis window aka. the plot window. In the window appearing you can select the image format to use, and then you can click on Image Options....
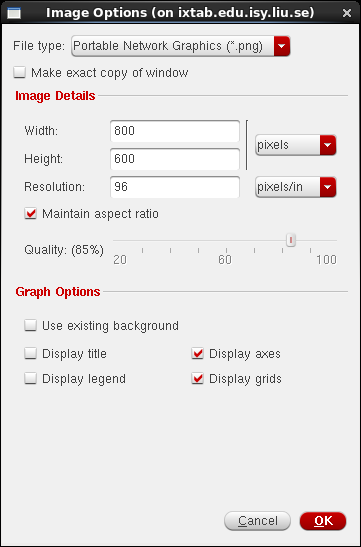
In the options window, see figure 3, you can select if you want to include the title, legend, axes and grid and also which size to use if you don't have a vector format. For Word and similar tools PNG or SVG are good formats, SVG is vectorized which means that you can resize the image without loosing quality and for Latex PDF is the best choice.
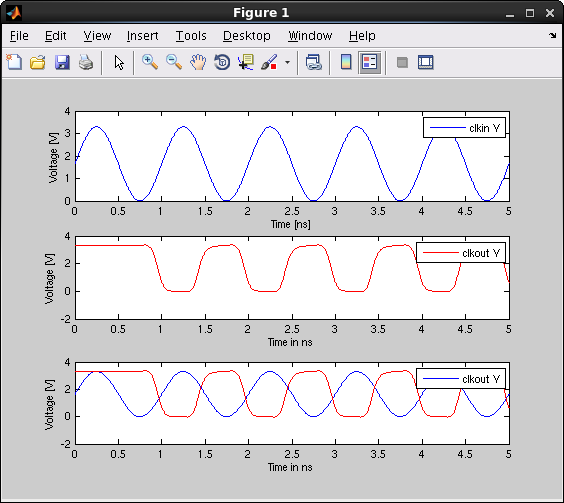
The other way is to export the data to Matlab, or any other tool, and plot it from there. For example if you want to plot the graphs using Matlab click on the graph you wish to export, and shift click to select more than one, right click on one of the selected graphs and select Export..., then select the format use want to use, in this example CSV, and if you want to clip the data. Save the file and open Matlab. Run the following code to load the file and plot the, in this case, two graphs in two different subplots and both in one.
    data = importdata('test.csv');
    subplot(3, 1, 1);
    plot(data.data(:, 1).*1e9, data.data(:, 2), 'b');
    legend(data.textdata(2));
    xlabel('Time [ns]'); ylabel('Voltage [V]')

    subplot(3, 1, 2);
    plot(data.data(:, 3).*1e9, data.data(:, 4), 'r');
    legend(data.textdata(4));
    xlabel('Time in ns'); ylabel('Voltage [V]')

    subplot(3, 1, 3);
    plot(data.data(:, 1).*1e9, data.data(:, 2), 'b',
         data.data(:, 3).*1e9, data.data(:, 4), 'r');
    legend(data.textdata(2), data.textdata(4));
    xlabel('Time in ns'); ylabel('Voltage [V]')
This results in a plot similar to that in figure 4. This Matlab plot can then be edited and saved as any Matlab figure and included in your documentation.
If you want to use another software the format in the CSV file is: Signal 1 X, Signal 1 Y, Signal 2 X, Signal 2 Y etc., the first row contains the names of the signals in that column.
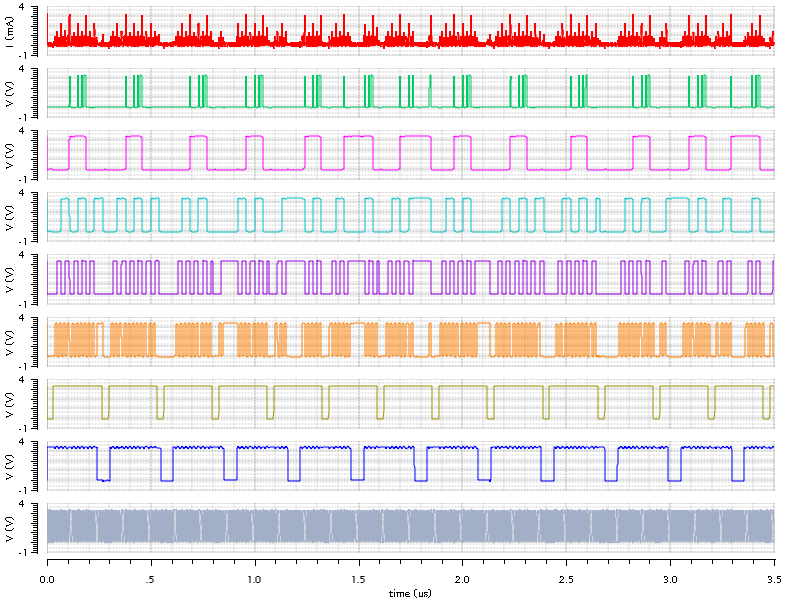
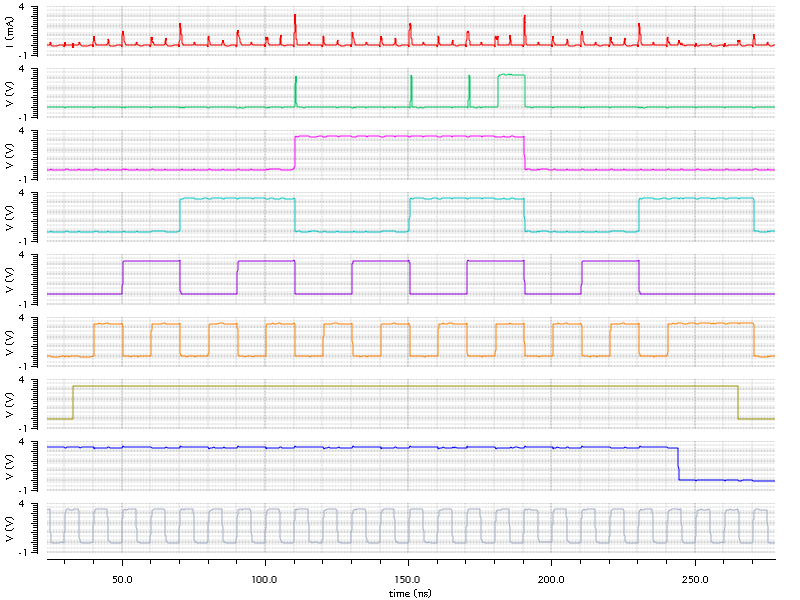
Another important thing to consider when including simulation results is if they are relevant and clear. A plot that shows a too large span on time is often useless, see figure 5, for example is the reset synchronous or asynchronous? Instead look at figure 6 where the exact same plot is used but zoomed in over just the first cycle, it is much easier to see the different timings and that the counter is working correctly.
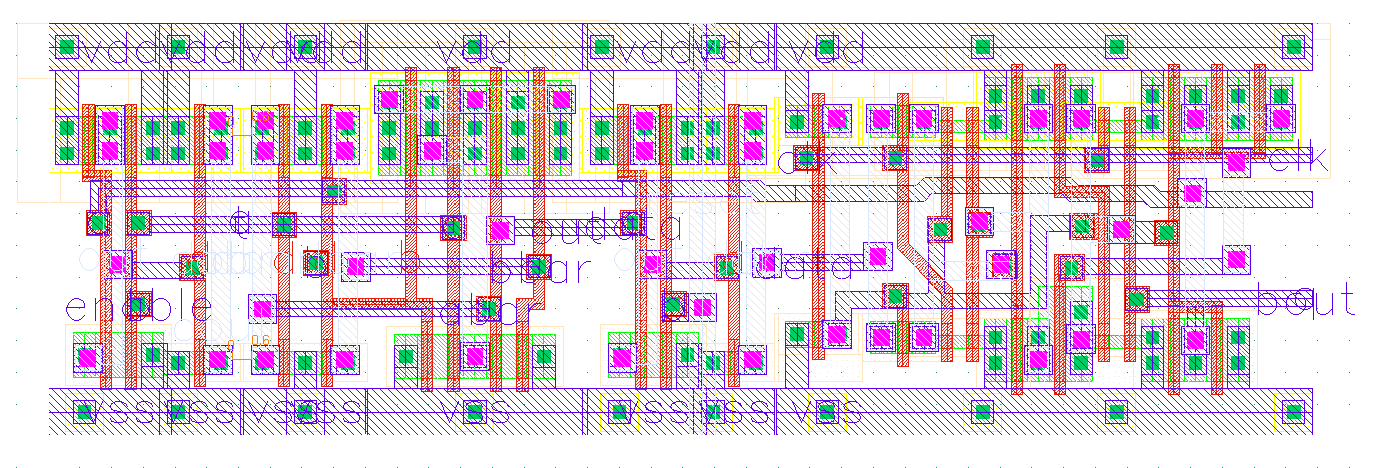
Export Layouts
Including layout pictures of important blocks might be illustrative in some cases. To get good layout picture you should use the same approach as with schematics, click File -> Export Image... and select a transparent background. To avoid unnecessary space around the layout you can select a different Export Region, visible area and entire design are self explanatory but to use selected area you first click Select... and then click were you want the selection box to start and then click where you want it to end. It can some times be useful to hide layers which is not necessary to include, do this by deselecting the check box in the V (Visible) column for the appropriate layer in the layers assistant. See figure 7 for an example of a exported layout.
Sometimes it is necessary to crop the image in for example GIMP to remove some of the empty space around the layout.
