Dense Debugger
When developing software systems and algorithms debugging is crucial. That was the case during this project and the result can be found in the developed debugging user interface, the Dense Debugger.
Pipeline overview
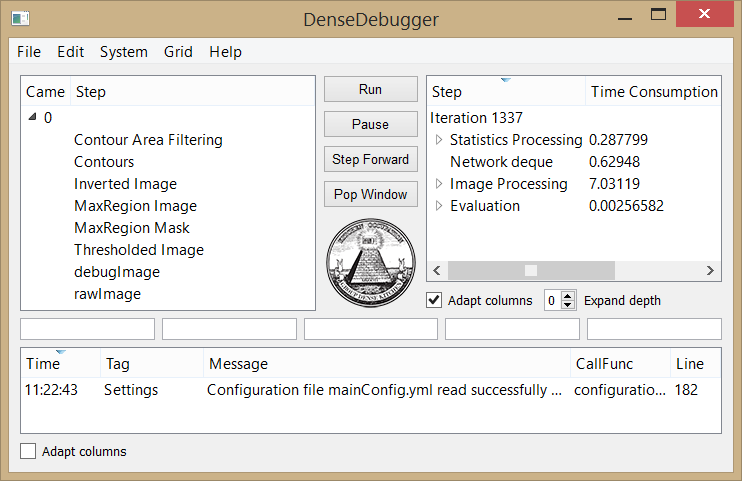
In the upper left corner of the dense debugger is the pipeline overview. It shows all the intermediate image processing algorithm steps currently available. By selecting one of the algorithm steps and klicking the “Pop Window” button, the image will be displayed in the window grid (see below).
Profiling
In the upper right corner of the debugger, profiling information is found. Profiling is available for all algorithms that are currently registered in the pipeline and is shown in milliseconds.
Logger
The bottom square of the program is reserved for log messages. Log messages provide information about any system errors or warnings and provides detailed information about where and why any error occured.
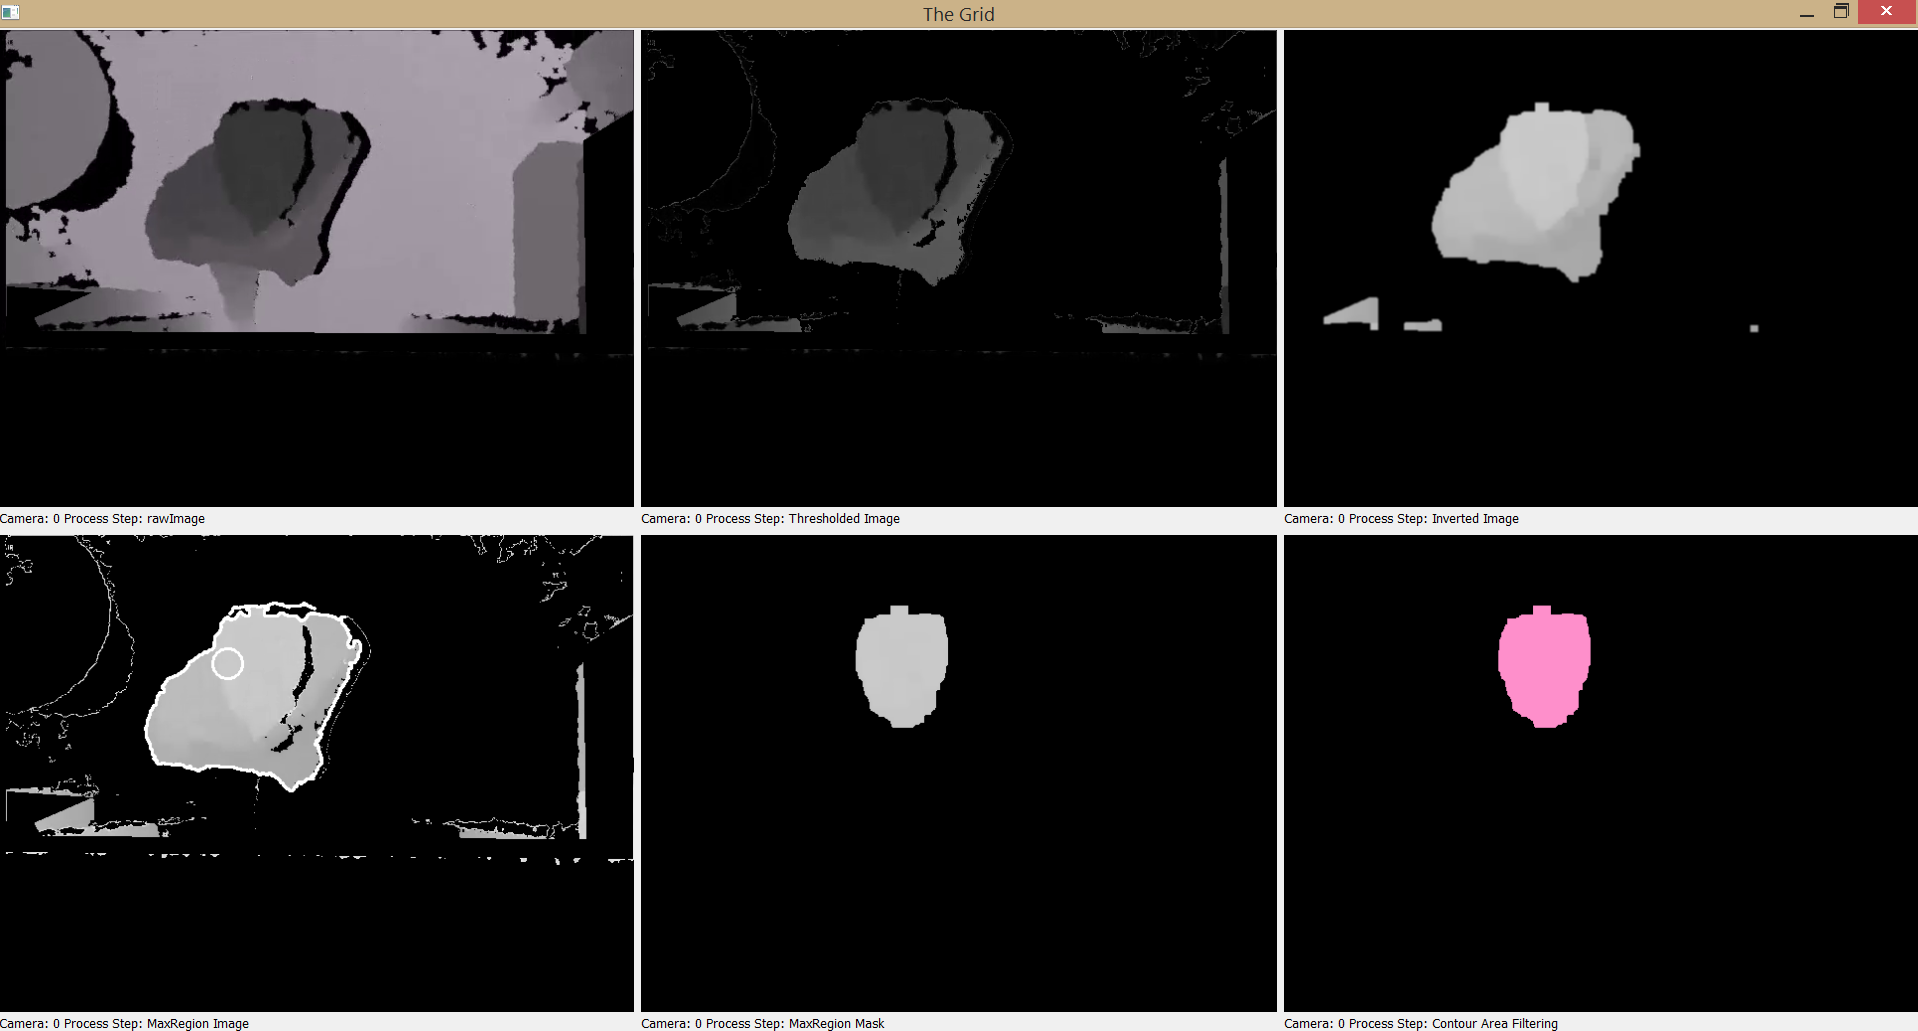
The Grid
The grid is where the image s end up after being popped by the “Pop Window” button. The grid is an excellent way of visualizing all the different intermediate image processing steps. Below is an image of the grid with six different image processing steps shown.